How to Record Scripts Using Screener Recorder
The following steps show how to record your first script with Screener Recorder:
1. Open Screener Recorder & Sign-In
After installation, access the Screener Recorder by opening Chrome Developer Tools. An additional tab is added called "Screener Recorder".
You will need to sign-in with your Screener login, as the Screener Recorder syncs with your Screener account to access your latest projects, test groups, and scripts.
2. Record a Test
After signing-in, the Screener Recorder will display the currently selected Project and Page, which should be the new Project you just created. There will be nothing recorded, so you will be presented with an empty list:
![]()
Click on the blue record icon to start your first recording. This will load the selected Project/Page url into your current tab in Chrome.
When the url has completed loading, the record icon will change it's status to "Recording", and you can start interacting with the page. Any click and text input actions you perform in the browser will be automatically recorded, and be displayed in the steps list:
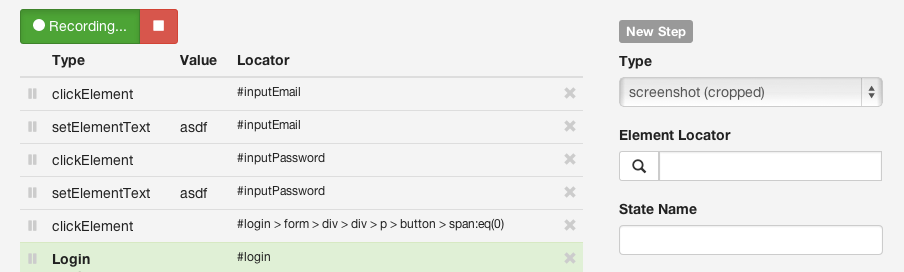
At any point during your recording you can add custom steps by using the "New Step" form to the right of the steps list.
For example, to capture a particular state, open the Type dropdown under "New Step" and select either "snapshot (cropped)" or "snapshot (full page)". Fill in the form fields for capturing a snapshot, and click "Add Step" at the bottom of the form. This will add the new capture step to the end of the steps list.
Click the icon to stop a recording.
- Remember to add a snapshot step for each UI state you want to validate. Snapshot steps need to be added manually.
- To re-order steps, simply drag/drop the step up or down the list.
- For ajax loaded content, use the "wait for element" step type to wait for either an existence of an element, or the visibility of an element. Use the jQuery pseudo-selector ":visible" in the element locator field to wait for an element to be visible.
- An explicit wait time can optionally be added to snapshot steps. This is useful when you want to wait for an animation to finish before capturing the snapshot.
- To add a new step after another step, click on the step you want to add the new step after. You will see the step details under "Update Step". Change the details by entering the new step details and click "Add After".
3. Playback & Save Recording
After recording a script, you should always play it back within the Screener Recorder to catch potential issues and to help debug.
Click on the icon next to the blue record button to playback your recording:

During playback, the page will reload to ensure it is in a clean state, and the elements being interacted with will automatically scroll into view and highlight in red to help you see what is going on. Any snapshots are also highlighted in white to help you visualize what states will be captured.
When you are happy with the recording, you can save it by clicking on the button (see below). This will upload your recorded script to Screener, and the script will be executed on your next test run.

- If you are unhappy with your recording, you can revert any edited recording to the last saved by opening the icon and selecting "Revert to Last Saved".
- To help debug, you can set breakpoints by clicking on the icon on the left of each step. Step through steps one at a time by setting multiple breakpoints in a row.
4. Run Test
When you have completed recording your scripts, you can execute a test run within Screener by going to the project Dashboard in the Screener app, and clicking on Run Test in the Test Group with your recording.
5. View Logs
You can view logs for each test run via the History tab for each Test Group. Logs are useful to help debug any errors or timeouts which may occur during a test run.
To view a list of WebDriver Error Codes which may be returned in the logs: https://code.google.com/p/selenium/wiki/JsonWireProtocol#Response_Status_Codes